The ETF Ledger Turns Positive While Bitcoin Refuses the Easy Story

The Friday Print Moved the Ledger
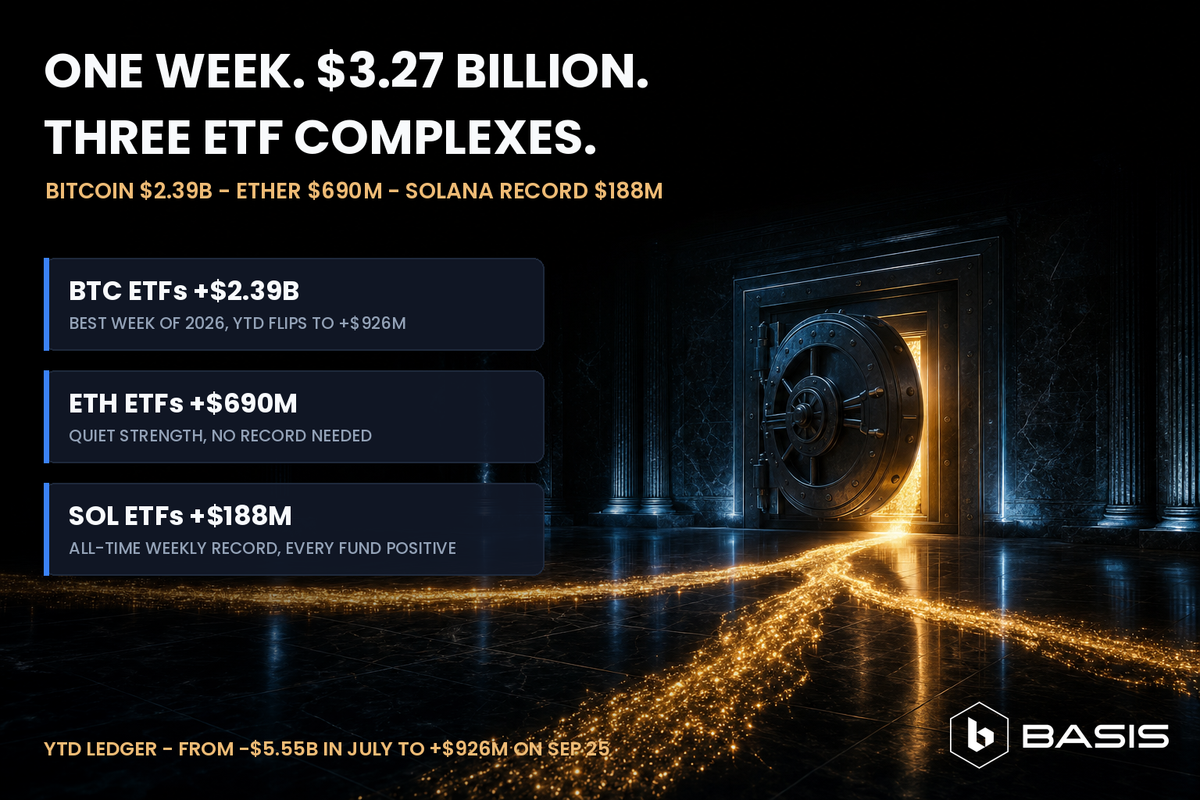
The signal came from the ledger before it came from the chart. US spot Bitcoin ETFs added $134.5 million on Friday, September 25, according to SoSoValue data cited by Yahoo Finance, sealing a $2.39 billion week.
The arithmetic matters. Spread $2.39 billion across five sessions and the week averaged roughly $478 million per day. Friday's $134.5 million ran well below that daily pace, yet it still sealed the best weekly figure of 2026. That tells you the heavy allocation work happened before the closing print, not in a final-session chase.
The week was the strongest since October 2025 and ahead of the prior 2026 high of $1.92 billion set in August, by about $470 million. It stopped short of the $2.71 billion all-time weekly record from the week ending October 10, 2025, with a gap of about $320 million. That is close enough for the honest frame to be precise: strongest since October 2025, not a new all-time weekly record.
It did something more relevant for allocators. For the first time in 2026, year-to-date net flows turned positive, at about +$926 million.
The Flip After a Negative Year
The flip matters because the 2026 ledger spent most of the year below zero. Early July showed a deficit of roughly -$5.55 billion. Moving from that point to +$926 million is a gross swing of about $6.48 billion. This publication's September 6 article, "September Was Supposed to Break Bitcoin. ETFs Pulled $3.8B in Three Weeks," recorded year-to-date Bitcoin ETF flows at about -$1 billion, even after roughly $3.8 billion had entered US spot Bitcoin ETFs across the three weeks ending September 4 to 5 and August had delivered $3.5 billion, the strongest month since September 2025.
That earlier file also put cumulative net inflows since the January 2024 launch at $55.6 billion, with total assets across all US spot Bitcoin ETFs at $101.3 billion after briefly touching $103.3 billion. The September 25 print at +$926 million means the ledger swung roughly $1.9 billion into positive territory in three weeks. Sharp turn, incomplete trend.
The institutional meaning sits in that distinction. Many allocation committees judge a product class by its annual net creation ledger. If the number is negative, the investment memo has a standing objection: the wrapper is redeeming in aggregate. A positive year-to-date number does not prove the exposure belongs in every portfolio. It removes an objection. The case still has to be built on durability, breadth, liquidity, custody, and portfolio role.
Breadth Becomes the New Signal
Bitcoin was not alone. US spot ether ETFs attracted roughly $690 million over the same week, while US spot Solana ETFs posted their biggest week yet at $188 million. Together, the three complexes took in about $3.27 billion in five sessions.
The ether number is quiet strength. There was no record attached to it, which is itself a signal. Demand for the second asset is normalizing rather than arriving only in headline spikes. That is what mature ETF markets tend to look like: not every allocation print has to be a spectacle to matter.
Solana was the sharper breadth story. Every US spot Solana fund posted inflows. Bitwise BSOL took about $128 million, roughly two-thirds of the weekly total, while Grayscale GSOL added $28 million, Fidelity FSOL added $18 million, and Morgan Stanley, VanEck, Franklin Templeton and 21Shares shared the remaining $14 million. Friday was the strongest Solana session, about $87 million, including $56 million for Bitwise.
Lifetime Solana ETF net inflows stand at about $1.6 billion, of which BSOL holds about $1.2 billion, but Bitwise's weekly share of 68% sat below its longer-term 76% share. Rival issuers gathered about $60 million. That is the first real evidence that Solana ETF demand is distributing across issuers rather than staying concentrated in the first mover.
This is no longer a single-asset, single-issuer story, though the September 6 file still showed BlackRock's IBIT at $62.52 billion of net assets, about 62% of the Bitcoin sector. The center of gravity in Bitcoin remains concentrated. The new information is that marginal demand is now showing up across ether and Solana as well.
Solana's flows also arrived as the Alpenglow upgrade advanced on the public test network, designed to cut the time before a payment becomes final from about 12.8 seconds. Settlement finality measured in seconds, moving toward a design goal far below the current 12.8 seconds, is the kind of infrastructure progress product issuers can underwrite. A spot ETF wrapper is easier to defend when the underlying network is not merely trading, but also showing measurable work on settlement.
SOL traded near $119 in Monday Asian hours, still about 60% below its record near $293. That is the same flow-versus-price separation now appearing one market layer down. Listed-product demand is broadening while the underlying asset remains far below its own high.
Plumbing Matters Because It Leaves Footprints
In the September 6 piece, we spent time on the plumbing. The compressed version is that authorized participants create and redeem ETF shares against actual bitcoin held at custodians. The fuller version is why those prints deserve more weight than the exchange tape alone.
When secondary-market demand pushes an ETF's price above the value of its underlying holdings, an authorized participant can step into the gap. It delivers cash or bitcoin to the fund, receives newly created shares, and sells those shares into the market where buyers are paying the premium. The fund's share count rises. The custodian balance grows. The allocation leaves a custody footprint.
Redemption runs the same machine backward. Shares are returned to the fund, underlying exposure is released through the fund process, and the custodian balance falls. The important point is not that ETF flows force price to move immediately. The important point is that primary-market creations and redemptions record actual changes in the listed wrapper's asset base.
Exchange turnover can recycle the same coins between the same wallets a hundred times in a day. Social sentiment can be manufactured for the cost of a botnet. A primary-market creation cannot be manufactured in that way. It requires an authorized participant to commit balance sheet, a fund to issue shares, and a custodian to record more bitcoin. That is why a $2.39 billion week is evidence and a trending hashtag is not.
Treasury Buying Through the Range
The same week also showed corporate treasury conviction. Strategy acquired 1,665 BTC between September 21 and September 27 at an average price of $85,681 per coin including fees, for $142.7 million. Holdings reached 847,666 BTC, accumulated for approximately $63.95 billion at an average cost of $75,437 per bitcoin. The prior week, the firm bought 950 BTC for approximately $75.7 million at an average of $79,670.
In the same window, the company sold $246.2 million of MSTR shares and repurchased $151.7 million of STRC. That is active management of the securities stack funding the accumulation, not passive holding. Common equity issuance, a repurchase in another layer of the structure, and bitcoin acquisition all occurred in the same window. The balance sheet was being shaped while the coin count rose.
Saylor reported $6.02 billion in USD assets and a 3.8-year USD duration as of September 27. A 3.8-year USD duration against $6.02 billion of dollar assets is a liquidity buffer sized so that no bitcoin needs to be sold to meet obligations through a full cycle. The structure matters because forced selling risk is often more important than headline conviction.
Buying 1,665 BTC at $85,681, above the $75,437 average cost of the 847,666 BTC stack, is conviction buying, not dip averaging. It raises the average cost rather than lowering it. A buyer with that profile is not waiting for the trendline to confirm. Treasury desks and fund complexes are not trading the range, they are allocating through it.
Price Refused the Easy Confirmation
The hard part is that price refused to confirm the flow in a straight line. Bitcoin fell toward $83,000 during the very week inflows hit their 2026 peak, then traded around $83,150 on Sunday, September 28 after another rejection near $85,000. The September high near $87,350 was the strongest level in eight months, and Bitcoin secured a weekly close above $84,000, its highest weekly finish in eight months, after a rally of about 45% from the June bottom and an August trough near $63,000.
The September 29, 06:00 UTC API snapshot put BTC at $83,468, ETH at $2,671.78, and SOL at $118.04, with 24-hour changes of +0.33%, +0.85%, and -0.71%. Binance perpetual funding rates were flat to mildly positive at +0.0038% for BTC, +0.0070% for ETH, and +0.0013% for SOL per eight hours, not an obvious leverage overheating signal.
That is not a contradiction. Creations recorded this week can be satisfied against coins sourced over days through OTC desks and exchange books, so the flow timestamp and the price impact do not have to share the same week. Authorized participants can inventory, hedge, and settle through the fund process while spot price is still clearing other flows.
Meanwhile, the secondary market still clears every macro hedge, every range seller at $85,000, and every profit-taker from the 45% rally off the June bottom. ETF demand may be real and still meet enough supply to keep price pinned inside a range.
Flat funding near +0.0038% on BTC perps tells you the rally is not being carried by leveraged longs. That historically makes pullbacks shallower, though it offers no guarantee. Daily RSI at 59.54 is above neutral but below overbought, while MACD remains positive. That is momentum that paused, not momentum that broke.
The conditional map is narrow. The $82,000 to $83,000 ascending trendline demand zone has attracted buyers throughout September. If it breaks, Blockonomi's scenario opens $75,000 to $77,000, with deeper support at $65,000 to $67,000. If bulls recapture $85,000 and then clear $87,000 to $88,000 decisively, attention shifts to resistance near $94,000 to $97,000.
The Macro Tape Still Pushes Back
The counterweight is not subtle. The Federal Reserve raised rates by 25 bp on September 16, taking the federal funds target range to 3.75% to 4.00%, citing inflation that "remains elevated." A ten-year yield at 5.24% raises the hurdle rate every risk asset must clear, and it arrives with the policy rate already higher after the September 16 move.
On Polymarket, traders price a further 25 bp hike at the Fed's October meeting at about 65%, with no change near 34% and any cut below 1%, on around $15 million in volume. That is a snapshot of positioning, not a certainty. It can reprice on a single inflation print.
Yahoo Finance quoted the US 10-year Treasury yield at 5.24%, VIX at 16.07 up 8%, gold at $4,168.20, a seven-week low after a roughly 3% drop, crude at $94.34, and the dollar near a two-month high amid the US-Iran standoff over oil. This publication's August 13 article verified that the United States and Iran have been in active armed conflict since late February 2026, and that the Strait of Hormuz, which carried roughly one fifth of global oil supply shipments before the conflict, remains largely closed.
The oil channel is the live inflation risk. With the Strait of Hormuz largely closed since the conflict began in late February 2026 and November crude at $94.34, the energy tail sits inside every inflation forecast. That is exactly why the Fed hiked into a market that was hoping for a pause.
Gold at a seven-week low of $4,168.20 despite an active regional war tells you the dollar, at a two-month high, is absorbing the haven bid instead. That matters for Bitcoin because the same dollar strength that pressures gold can pressure liquidity-sensitive assets, even when ETF demand is constructive.
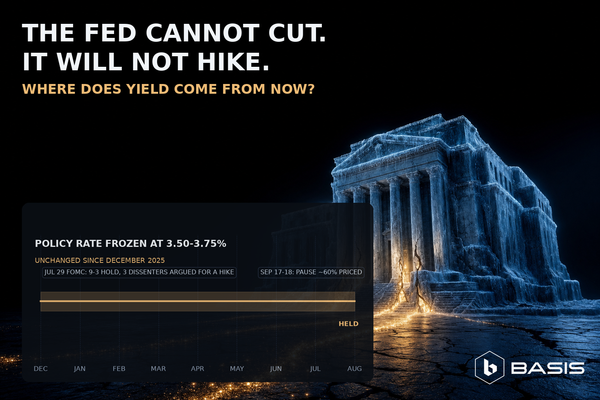
Before the September 16 move, the policy rate had been frozen at 3.50% to 3.75% since December 2025. Bitcoin has already rallied through one rate hike, as CCN framed it, which means liquidity, ETF demand and positioning may be doing more explanatory work than rates alone. Still, a 5.24% ten-year yield, a firm dollar, and hawkish rate expectations are headwinds. One record week is a data point, not a trend. The sentiment regime is Greed, not fear, with the index at 73 and holding between 70 and 78 for over a week.
The Allocation Signal Hiding in Plain Sight
September was supposed to break Bitcoin. Instead, it produced the strongest three-week inflow stretch of the year, then the strongest single week of the year, while price did nothing spectacular.
This publication documented the curse failing in real time. A $236.5 million outflow on September 1 flipped to $730.8 million of inflows by September 3, the largest single-day haul since January 14, 2026, then $986.9 million for the week ending September 5. Now the month closes with the best single week of the year.
That sequence matters because it did not arrive with a clean emotional setup. The chart did not offer release. It offered a range, rejection near $85,000, a defended $82,000 to $83,000 zone, and macro noise from rates, oil, and the dollar.
The evidence of allocation lives in custody accounts, not in the emotional temperature of the chart. It keeps arriving on days when the chart gives nobody a reason to feel anything. For allocators, this is the separation worth studying: conviction can settle while price discovery argues with rates, oil, the dollar, and every short-term seller in the book.
The investors who wait for the chart to feel right are often late to what the custody ledger already recorded. That does not mean price must obey flows immediately. It means the file of institutional behavior is being written somewhere other than the candle.
BASIS and the Market Neutral Reading
For BASIS, the read-through is narrow by design. A market-neutral yield engine does not need the flow-versus-price argument to resolve. It needs two-sided markets, venue gaps, funding differentials, and credit demand. A week when $3.27 billion enters listed products while price chops sideways inside a range is the environment this design is built for.
BASIS was founded on February 4, 2026. LEI: 254900IX2F2KCWNSSS64. Its Pre-Series A raise of $35 million came in September 2025. Research partner: Base58 Labs, registered in the UK, Companies House No. 17094713. The yield engine has three mechanisms: perpetual futures funding-rate capture, cross-exchange price dislocation arbitrage, and blue-chip DeFi lending.
Funding-rate capture earns the carry between spot and perpetual futures whichever way price resolves the range. If spot Bitcoin is resisted near $85,000 while perps still price a mild long bias, the spread can be harvested without requiring a directional breakout.
Cross-exchange price dislocation arbitrage is the venue-level expression of the same week. When $3.27 billion of primary-market demand routes through a finite set of exchanges, custodians, fund processes, and hedging desks in five sessions, gaps can open between where spot clears and where derivatives imply fair value. The point is not to forecast the closing price. The point is to harvest the dislocation created by flow.
Blue-chip DeFi lending earns from credit demand that does not care whether bitcoin closes the week at $83,000 or $87,000. Borrowers need liquidity for hedges, collateral movement, basis trades, and inventory. That demand can remain active while the headline chart looks indecisive.
The platform expanded beyond bitcoin on March 10, 2026, adding ETH, SOL, and PAXG strategies. The Solana ETF record this week is therefore directly relevant to a strategy universe that already includes SOL. ETF demand broadened into the same asset set where the platform had already expanded.


The execution engine, BHLE, operates at sub-50 microsecond latency with 100,000+ operations per second. In a dislocation strategy, speed is not decoration. A spread that exists between venues can narrow quickly, and stale execution can turn a neutral spread into directional exposure.
BSCB, the BASIS Sentinel Circuit Breaker, automatically halts all strategy activity if principal loss risk reaches 0.001%. DMM, Defensive Maintenance Mode, is a controlled pause state for investigation and verification. Those controls matter most in the exact tape described here: strong primary-market demand, sideways spot price, active macro pressure, and moving liquidity across venues.
Certifications: ISO/IEC 27001:2022, Certificate No. SC62455E, and ISO/IEC 20000-1:2018, both verifiable on IAF CertSearch. SOC alignment ID 6489580/COC/SC. GDPR alignment ID 6489581/COC/SC.
The Calendar, Not a Forecast
Q3 2026 closes on September 30. Quarterly reporting will translate this month's flows into fund-level disclosures. That matters because allocators will no longer be reading only weekly flow tables. They will be able to compare this positive year-to-date turn across fund complexes, issuer share, and asset mix.
The Fed's October meeting now carries a 65% market-implied hike probability, with no change near 34% and any cut below 1%. That probability can move on one inflation release. The oil channel, the dollar, and the 10-year yield remain live inputs.
Weekly flow data prints every week. The next readings will show whether the +$926 million year-to-date flip holds, broadens, or reverses. The observable file for allocators is clear: custody flows, ETF breadth across three complexes, funding rates, and the $82,000 to $83,000 demand zone.
None of those require a price prediction to be useful. They require discipline about what kind of evidence each one provides. The chart shows the clearing price. The custody ledger shows allocation. This week, the ledger moved first.